Find the best real estate investments in your area.
Use neighborhood-level data, price trends, and AI-powered insights to find undervalued areas, track rising demand, and invest with more confidence.
Coverage across all 50 states · 200+ data layers · Census-tract precision
Free plan available. No credit card required.
The data edge that serious investors use
Research from anywhere
Underwrite a market you can’t visit this week.
Dwemer is a US neighborhood research tool built around Census-tract comparisons. When a potential market is a few states away, compare it using the same measures you use at home. Check income, rent burden, unemployment, home values, and Dwemer Scores before deciding where to research further.
Dwemer is for US neighborhood screening. It is not a property inspection or appraisal, and it is not a lead-list product.
Everything you need to underwrite a market
Stop bouncing between tabs. Dwemer puts tract comparison, deal calculators, live listings, and AI analysis in one place.
Side-by-Side Tract Comparison
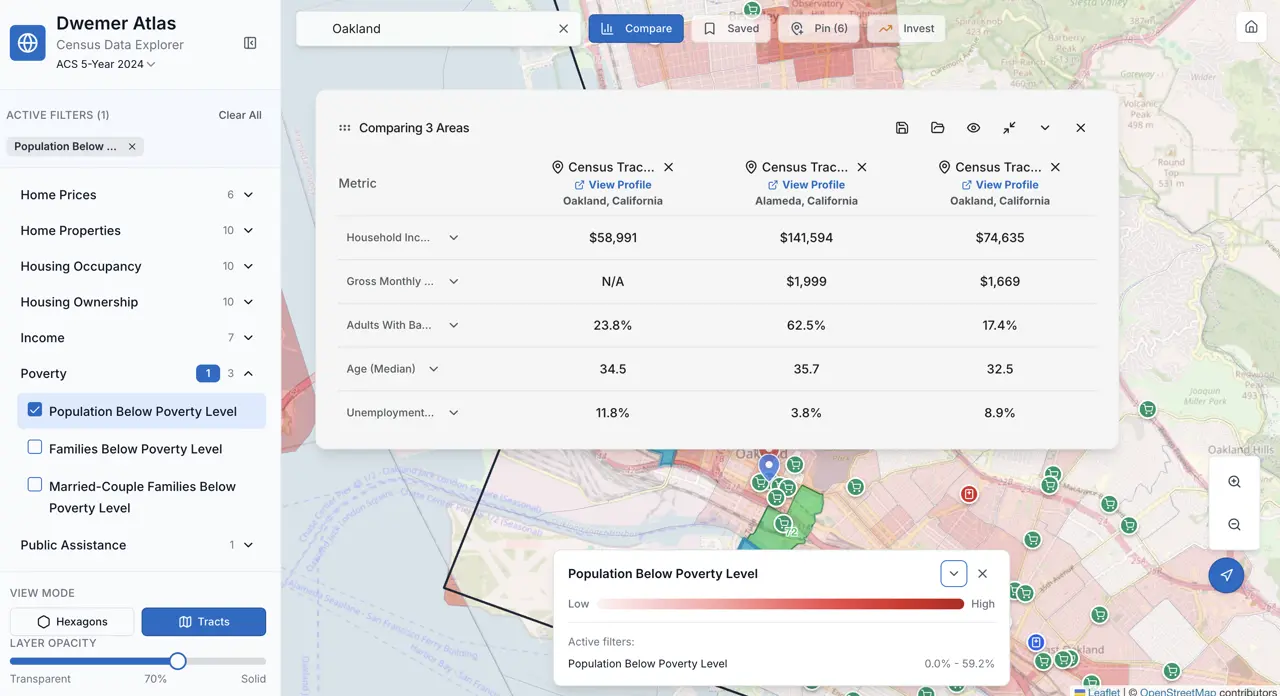
Pick any two census tracts and compare income, rent burden, unemployment, crime, home values, and 200+ other data points in real time.
Investment Calculators
Run cap rate, cash-on-cash, DSCR, and rent-to-price math right inside the map. No spreadsheet, no tab switching.
Real-Time Listings in Your Area
Active for-sale listings sit right on the map. Filter by price, type, or days on market. Every listing ties back to its census tract.
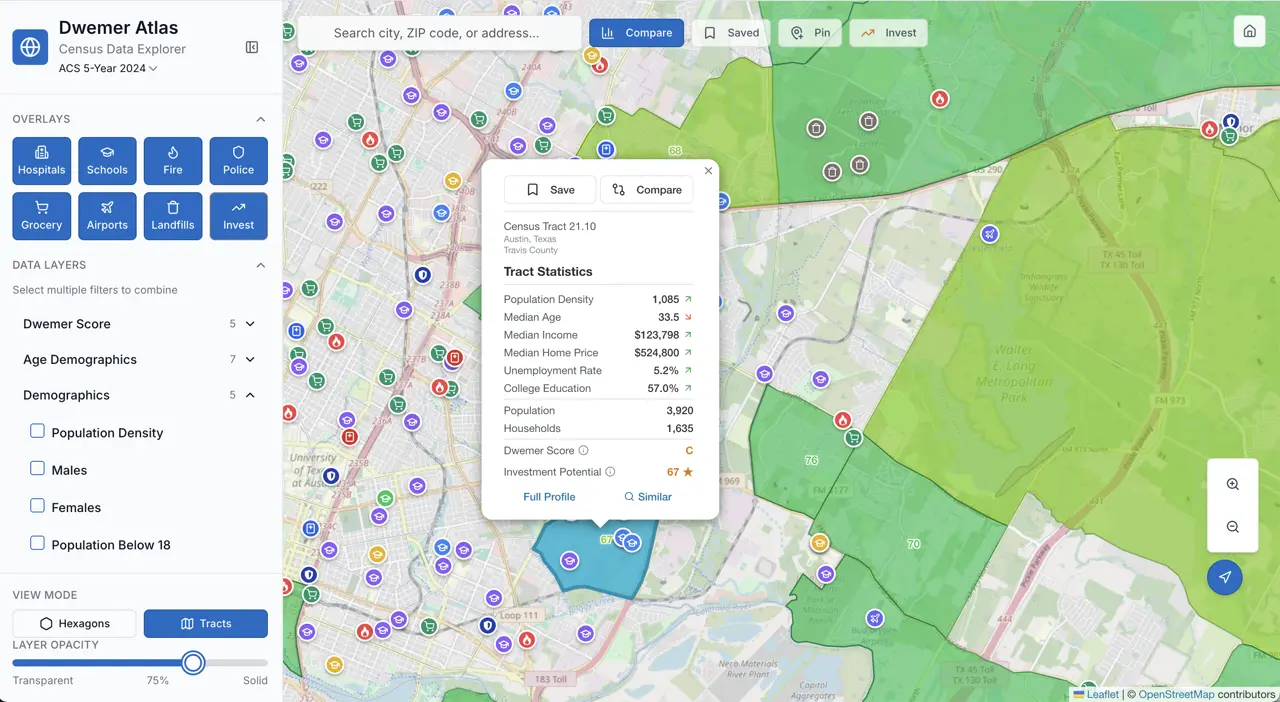
A look inside Dwemer
From a wide search to a tract you can compare.
Use the map to find an area, compare tract-level numbers, then review the Dwemer Score and AI analysis.
AI that finds deals.
Not just data.
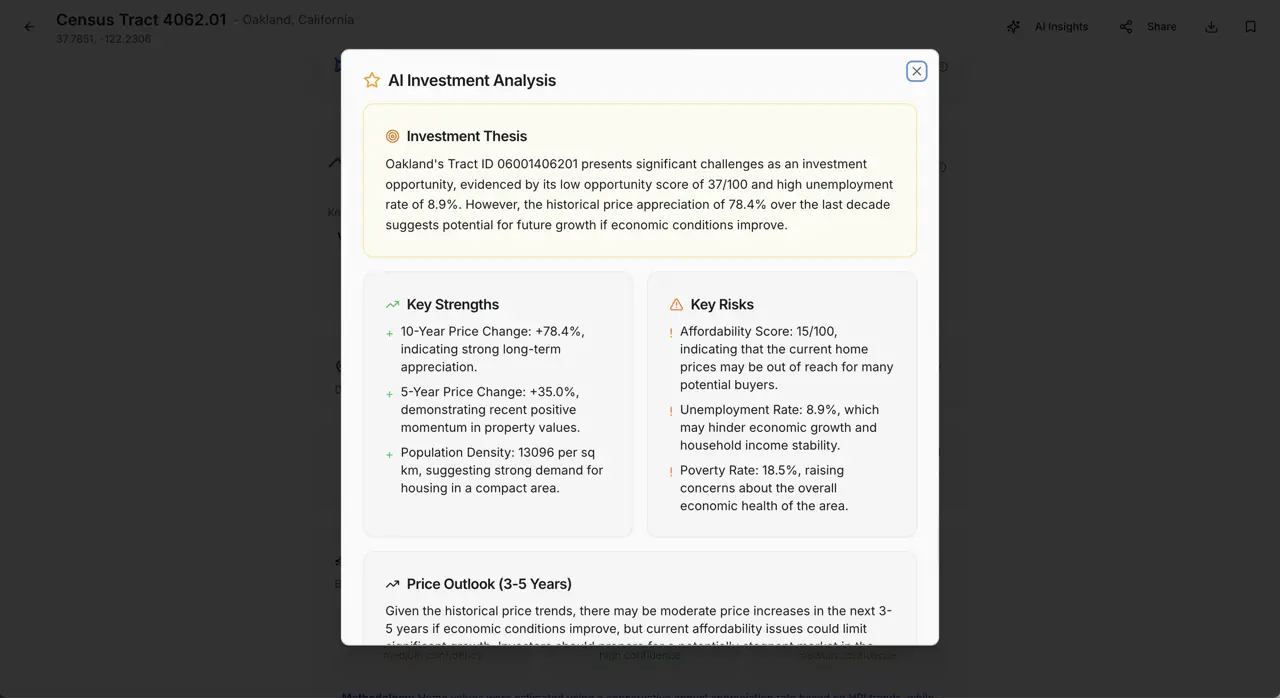
Our AI reads census trends, price appreciation, rental demand signals, and neighborhood trajectory. It tells you which tracts are worth targeting and exactly why.
Review the strengths and risks together.
Actual product screen. This is a snapshot, not a live recommendation or a guarantee of future performance.
Explore the Map
"I underwrite markets in 5 minutes that used to take me a full day. The tract comparison and AI scores completely changed how I look at deals."
Cara J.
Multifamily Investor, Austin TX
Find your next market.
Before your competition does.
Compare census tracts, run deal math, and use AI research to decide which markets deserve a closer look.
No credit card · All 50 states · 200+ data layers
Read our Privacy Policy.